Live plot
This demo combines two synchronized canvas types in the same
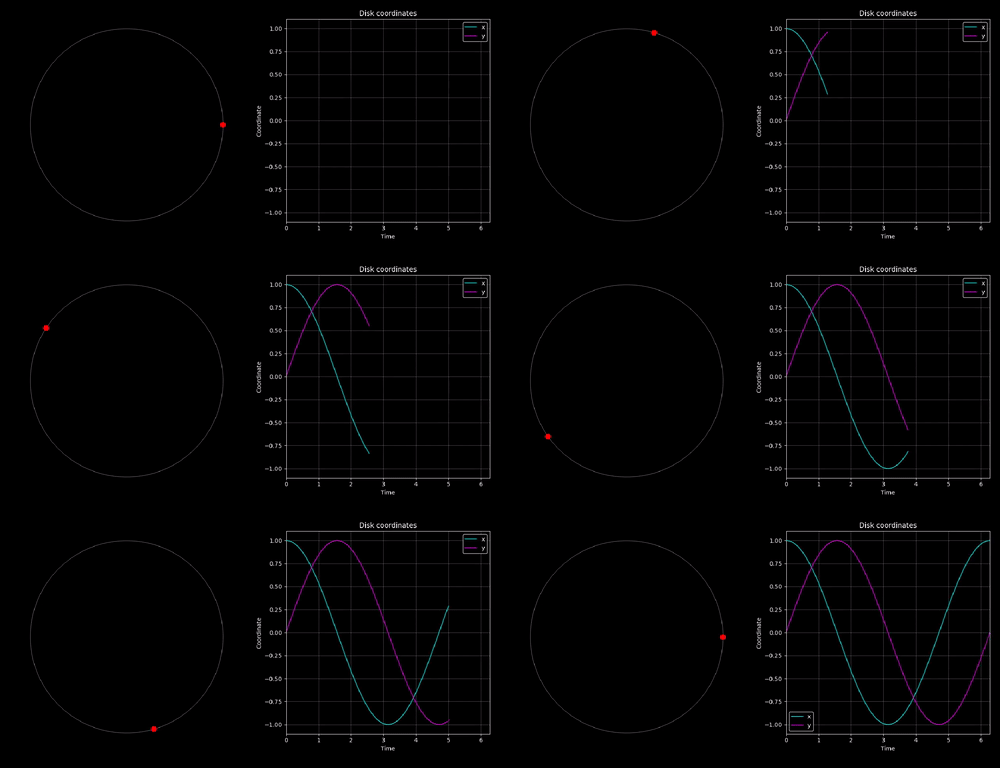
anim.window. On the left, an anim.plane.canva displays
a red disk moving around a circular orbit. On the right, an
anim.plot.canva displays the disk coordinates
\(x(t)=\cos(t)\) and \(y(t)=\sin(t)\) as live Matplotlib traces. Both
panels receive the same anim.time object, so the geometric motion
and the plotted data always represent the same animation step.
The plot constructor configures its exposed anim.plot.canva.axes
object directly. The two calls to plot return Matplotlib artists that are
kept in x_trace and y_trace; only their data need to change during the
animation. The legend automatically follows the dark canvas style.
self.axes.set_xlabel('Time')
self.axes.set_ylabel('Coordinate')
self.axes.set_xlim(0, 2*np.pi)
self.axes.set_ylim(-1.1, 1.1)
self.axes.grid(True, alpha=0.3)
self.x_trace, = self.axes.plot([0], [1], color='c', label='x')
self.y_trace, = self.axes.plot([0], [0], color='m', label='y')
self.axes.legend()
In anim.plot.canva.update(), the displayed arrays are reconstructed
from the current t.step rather than extended blindly. This makes the plot
idempotent and reversible: revisiting a step produces exactly the same data,
and stepping backward removes samples beyond the current time. The final call
to super().update(t) redraws the Matplotlib canvas and completes the frame.
times = np.arange(t.step + 1)*self.window.dt
self.x_trace.set_data(times, np.cos(times))
self.y_trace.set_data(times, np.sin(times))
super().update(t)
The two panels are placed explicitly in adjacent grid columns. Their default relative width is identical, while the window’s aspect ratio provides enough horizontal room for both. Playback is limited to one revolution and backward stepping is enabled to demonstrate that both canvas types remain synchronized. See the Matplotlib plot canvas guide for sizing, multiple axes, styling and other update patterns.
Full Code
 1'''
 2Live plot demo
 3'''
 4
 5import numpy as np
 6import anim
 7
 8# ═══ Orbital animation canvas ═════════════════════════════════════════════
 9
10class OrbitCanva(anim.plane.canva):
11
12  # ────────────────────────────────────────────────────────────────────────
13  def __init__(self, window):
14
15    super().__init__(window,
16                     boundaries=[[-1.25, 1.25], [-1.25, 1.25]],
17                     display_boundaries=False)
18
19    theta = np.linspace(0, 2*np.pi, 200)
20    self.item['orbit'] = anim.plane.path(
21      points=np.column_stack((np.cos(theta), np.sin(theta))),
22      stroke='grey',
23      thickness=0
24    )
25    self.item['disk'] = anim.plane.circle(
26      position=[1, 0],
27      radius=0.03,
28      color='red'
29    )
30
31  # ────────────────────────────────────────────────────────────────────────
32  def update(self, t):
33
34    self.item['disk'].position = [np.cos(t.time), np.sin(t.time)]
35    super().update(t)
36
37# ═══ Live plot canvas ══════════════════════════════════════════════════════
38
39class PlotCanva(anim.plot.canva):
40
41  # ────────────────────────────────────────────────────────────────────────
42  def __init__(self, window):
43
44    super().__init__(window)
45
46    self.axes.set_title('Disk coordinates')
47    self.axes.set_xlabel('Time')
48    self.axes.set_ylabel('Coordinate')
49    self.axes.set_xlim(0, 2*np.pi)
50    self.axes.set_ylim(-1.1, 1.1)
51    self.axes.grid(True, alpha=0.3)
52
53    self.x_trace, = self.axes.plot([0], [1], color='c', label='x')
54    self.y_trace, = self.axes.plot([0], [0], color='m', label='y')
55    self.axes.legend()
56
57  # ────────────────────────────────────────────────────────────────────────
58  def update(self, t):
59
60    # Rebuild the traces from the current step so backward motion remains
61    # deterministic and never appends duplicate or out-of-order samples.
62
63    times = np.arange(t.step + 1)*self.window.dt
64    self.x_trace.set_data(times, np.cos(times))
65    self.y_trace.set_data(times, np.sin(times))
66
67    super().update(t)
68
69# ═══ Main ═════════════════════════════════════════════════════════════════
70
71W = anim.window('Live plot', aspect_ratio=2)
72
73W.add(OrbitCanva, row=0, col=0)
74W.add(PlotCanva, row=0, col=1)
75
76W.step_max = round(2*np.pi/W.dt)
77W.allow_backward = True
78W.allow_negative_time = False
79
80W.show()